|
|
 By
the turn of the century, the swelling Catholic community in New York
City had outgrown St. Peter's Church - the center of the Catholic
Diocese in New York at the time. Plans were drawn for a new
Cathedral to be built at Mott, Mulberry and Prince Streets, then
considered to be "in the suburbs of the city". By
the turn of the century, the swelling Catholic community in New York
City had outgrown St. Peter's Church - the center of the Catholic
Diocese in New York at the time. Plans were drawn for a new
Cathedral to be built at Mott, Mulberry and Prince Streets, then
considered to be "in the suburbs of the city".
Construction began in
1809 and, at the time of the dedication in May of 1815 the old Cathedral
stood as the largest religious edifice in New York City. For 57
years the structure stood as the center of Catholic faith, until tragedy
struck. On October 6, 1866, fire ravaged the Cathedral.
Amazingly, the four walls survived the fire and the Cathedral was
rebuilt in 2 years: the rededication took place in 1868.
A search by the
trustees for a new expanded burial ground in 1810 led them to purchase
the present site of the new St. Patrick's Cathedral for a mere $20,000,
after improvements. In 1850, Archbishop Hughes decided that a new
monumental Cathedral was to be built on the site, with most of the
planning meetings taking place at the old Cathedral. In
the
following excerpt from architect James Renwick's original report, he
presents the different possibilities for building stone:
"Our
opinion is therefore decided that there is no material which combines
the three essentials of durability, beauty, and economy as well as white
marble. As regards to comparative expense of the whole building in
the three materials, contractors estimate that the Cathedral will cost:
In
White Marble $830,000
In Albert Stone
$800,000
In Belleville Stone $805,000
In Dorchester Stone $830,000
From
the above it will be seen that the building will cost $50,000 more than
in the free stone. Our opinion is that the beauty and durability
of the former material would more than justify this additional expense,
an our belief is that if constructed of this beautiful material it will
be worthy of the noble purpose to which is will be dedicated as the work
of man's hands can be."
 Renwick's
argument for the white marble prevailed and the Cathedral was designed
and decorated in the gothic style, reminiscent of the Cathedrals of
Rheims, Amiens and Cologne. Renwick's
argument for the white marble prevailed and the Cathedral was designed
and decorated in the gothic style, reminiscent of the Cathedrals of
Rheims, Amiens and Cologne.
The first
cornerstone on the new center of the Archdiocese was placed in 1858 and construction of the cathedral as it
stands today continued through 1931.
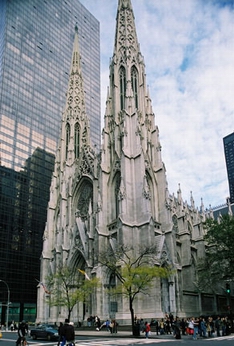
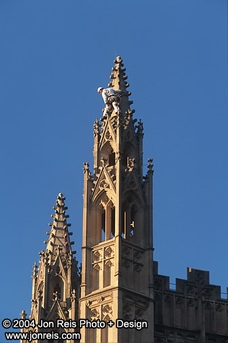
The cathedral is clad with at least three different types of
marble: the 330' spires
and towers are clad mostly in marble from Cockeysville, MD, lower
portions of the nave and tower, including the Fifth Avenue facade are
clad in Tuckahoe (or Pleasantville, NY) marble, and some of the more
recently replaced decorative elements on the Fifth Avenue facade are
carved from Lee (Massachusetts) marble.
The
Cathedral was opened formally on May 25, 1879
- thirty-five bishops and six Archbishops were present to honor the
blessing by Cardinal McCloskey.
Fighting the crowds on
Fifth Avenue in front of St. Patrick's Cathedral today it is hard to believe
that when Archbishop John Hughes first presented the idea of a new St. Patrick's Cathedral in 1853 he had to fight public
opinion that the new center of the Archdiocese was too far out of town. The Cathedral's midtown location is now a prime tourist attraction.
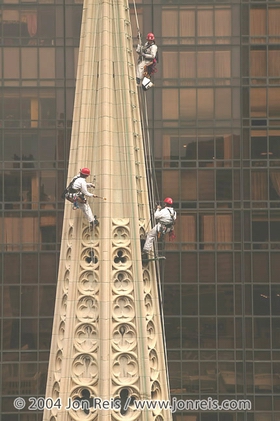
From
October 25 - 28, 2004
Vertical Access technicians Kent Diebolt, Mike Gilbert, Tom Zajicek, Stardust Atkeson
and Kelly Streeter acquired photographic and noted documentation of the
condition of the Cathedral. The inspection was undertaken to
investigate and document existing conditions of
the four facets on each of the north and south towers and spires, and
the west facade of the Fifth Avenue gable end .
A secondary purpose of the survey was to assist others in the
development of construction estimates, budget and work phasing plans,
and, if necessary construction documents leading up to a cyclic repair
campaign. The previous exterior repair campaign completed in the late 1970's
by Nicholson and Galloway was
completed with the utmost care.
Mike Gilbert annotated
his drawings directly in AutoCAD using the Tablet PC Annotation System (TPAS). To learn more about the history of the
development of the TPAS system, go to www.vertical-access.com/handheld.html.
For information about and the TPAS system, see the article on TPAS,
below. -Kelly Streeter, Photos by Jon Reis
back to top
Technical
Highlight: Radio Frequency Safety
 |
RF
Symbol used wherever
overexposure to RF or MW
radiation is possible |
Architects
and Engineers who routinely find themselves clambering around
buildings are often unaware of a possible silent danger. With
the explosion of technology over the last several years, antennas,
sprouting up in unlikely places, are a potentially dangerous source of
radio frequency (RF) and microwave (MW) radiation. Whereas
workers who service this equipment undergo training and wear
protective gear, architects and engineers might be exposed
unwittingly.
In general,
humans are not in grave danger of high radiation exposure unless they
are near a device and then the level of exposure is greatly dependent on the type
and path of the directed energy. The primary
health effect of RF/MW energy results from the heating up of human tissue
- the extent of this heating is related to the absorption which
varies with the frequency of the energy. Microwave energy
(higher frequency) is not absorbed deeply into tissue - so the main
concern is "near surface" effects - those close to the
skin. Whereas RF (lower frequency) energy penetrates more deeply
and can affect organs.
The
following table offers a guideline for antenna safety:
| Antenna Type |
Description |
Danger |
Photo |
| Cellular: radio |
Cellular
antennas are split into two basic types, the first being the cellular
radio service, which operated at frequencies about 800-900
MHz. |
In
both the cellular and PCS cases, an individual would have to
stand in the the main transmitting beam within a few feet of the
antenna in order to be exposed to levels at or near the FCC
limits for exposure. |
|
|
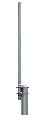
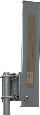
| Cellular: PCS |
he
PCS antennas come in two main forms: omni-directional and
sector. The omni directional antennas are 10-15' poles
where the sector antennas (which are more commonly used in urban
areas are approximately 1' x 4' rectangular antennas |
In
both the cellular and PCS cases, an individual would have to
stand in the the main transmitting beam within a few feet of the
antenna in order to be exposed to levels at or near the FCC
limits for exposure. |
|
|
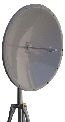
| Microwave |
Microwave
or "point-to-point" antennas transmit and receive
microwave signals across short distances (.5 - 30+ miles).
They transmit directly from transmitting to receiving
antennas and the exposure limits outside of this relatively
narrow beam is minimal to insignificant.
|
Significant
exposures from these antennas could only occur in the unlikely
event that an individual were to stand directly in front of and
very close to an antenna for a period of time. |
|
| Satellite-Earth |
Satellite
to Earth antennas are pointed (of course) up to the sky to
receiving and redirecting satellites.
Because of the distances involved, the power levels are
very large when compared to microwave point-to-point antennas. |
This
energy is also very directional and therefore would not pose a
problem unless a worker were to stand in the narrow path for
some period of time. |

|
Whenever it is apparent that exposure to RF/MW radiation is a
possibility, workers should wear radiation monitors, which can note the type
(frequency) and level of energy encountered. Most of these
monitors allow the user to preset threshold levels and an alarm will
sound if that threshold is exceeded. -Kelly Streeter
Relevant links:
back to top
|
TPAS:
Tablet PC Annotation System
 Starting in 1997, Vertical Access began incorporating hand-written field notes into AutoCAD attribute tags or data blocks. These attribute tags are database records contained in the CAD file that appear as graphics on the drawing but, as distinguished from mere notes on paper, may be exported to a spreadsheet for sorting, tallying and for use as variables in estimating equations. At that time, this was a two-step process: First, one would take notes on paper in the field and then enter the notes as attribute tags in AutoCAD in the office while re-drafting the final graphical portion of the project deliverables. Starting in 1997, Vertical Access began incorporating hand-written field notes into AutoCAD attribute tags or data blocks. These attribute tags are database records contained in the CAD file that appear as graphics on the drawing but, as distinguished from mere notes on paper, may be exported to a spreadsheet for sorting, tallying and for use as variables in estimating equations. At that time, this was a two-step process: First, one would take notes on paper in the field and then enter the notes as attribute tags in AutoCAD in the office while re-drafting the final graphical portion of the project deliverables.
In 2001, Vertical Access began using hand-held, pen-based computers running under Windows CE with a CAD program capable of producing .dwg-compatible files for collecting data in the field. At that time, we were asked to document contractor-inflicted damage to a U.S. government building in Newark, NJ. Our charge was to locate and document every nick and over-cut mortar joint on the building. Notes were made on over 3000 conditions, with a photo supporting each observation.
Instead of draw-down menus, a system based on the full version of AutoCAD running on a tablet computer would mean using libraries of data blocks or attribute tags, rather than pull-down menus. AutoCAD's "Design
Center" allows easy access to the various data blocks. This approach has been developed by Mike Gilbert in our office and employs only the native capabilities of AutoCAD 2002, right "out of the box".
Placing the data block icon on the drawing calls up a prompt to enter the dimensions or extent of the fault. Photo ID numbers are also entered here if applicable. It is possible to calculate and enter the area (square feet) and length (linear feet) of a fault location and assign this information to the attribute tag.
Vertical
Access is currently working on developing programming for automatic
length and area calculations and photo linking capabilities.
Mike has pared-down the tool pallet to only the essential functions leaving the AutoCAD screen less cluttered and simpler to use in the field.
Building different "views" and switching layers off and on allows for interpretation of the graphical data and analysis of patterns of deterioration. This system makes GIS-like queries and analysis possible.
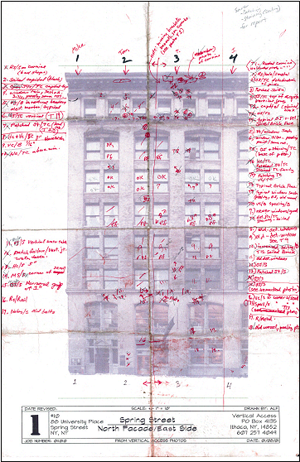
Before:
Using the old method of collecting, managing and presenting data, with
PocketCAD and ESA, the final product might contain a very dense amount
of information. Larger, complex buildings with numerous materials and
fault types require multiple plots per elevation to clearly portray
conditions found. Currently, Vertical Access is looking into different
ways to portray the graphical data contained in our reports in order to
increase the utility of our project deliverables.
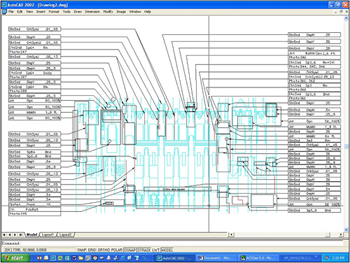
After:
The "after" elevation shown contains all of the graphical and
numerical information in the tags and leaders on the "before"
elevation. We feel that this is a much clearer way to present the same
information and has the advantage of being presented exactly as it was
entered in the field, with minor editing in the office.
The drawing can also be further simplified to contain only graphical
symbols, allowing for another means of organizing, presenting, and
interpreting data. We feel this greatly improves the ability to detect
patterns of deterioration.
 |
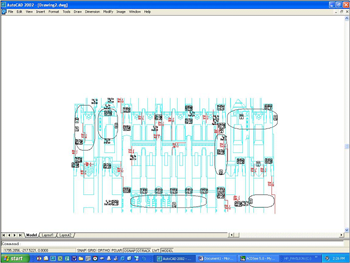 |
| Before: data as
previously represented |
After: graphical
representation of same data |
In summary, this is a fascinating time to be engaged in the development of systems for direct digital input of facade survey information. The emergence and dissemination of new approaches and the greater power and flexibility of mobile computing is rapidly changing the fields of Architecture, Engineering, and Construction.
Hardware and software development is leaping forward as computers become less expensive, more capable, and more robust. In addition, we are seeing the convergence of CAD and GIS capabilities, which will revolutionize the way we analyze and interpret survey data and influence how we prepare construction documents.
Furthermore, as these technologies grow, so will the number and type of its users. Although there are still unanswered questions and areas for improvement, the development of handheld computers has made an impact on the work of building professionals by creating more effective means of directly recording, interpreting, and managing facade survey data.
-excerpted from a presentation by Kent Diebolt
Three
helpful references, by Edward R. Tufte (Graphics Press, USA) are:
Envisioning Information (1990)
The Visual Display of Quantitative Information (1983)
Visual Explanations (1997)
To view the complete presentation or
download sample files, go to the resources page on our website, http://www.vertical-access.com/resources.html
back
to top
St.
Thomas Church
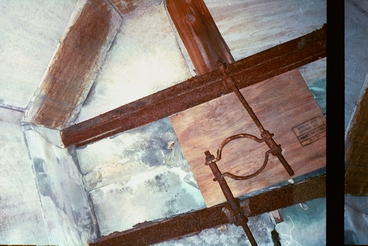 |
| Rusting steel
support |
During Vertical
Access' July inspection of St. Thomas Church, a continuously open
horizontal joint extending around the entire northeast turret was
noted. The joint had apparently reopened after being repointed
eight years ago. The four stone pieces capping the turret had
lifted off the top of the mortar joint by about 1/8".
After inspection from the inside of the stair, rusting steel support
structure was found to be the probable culprit of the open
joint. A follow-up visit on a rainy day confirmed the
suspicion - rain was pouring in the open joint, further contributing
to the rusting of the steel and the staining of the
stone.
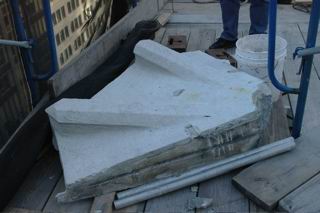
Partially in
response to Vertical Access' findings, the Church is in the process of removing and replacing the
stone cap and underlying structure.
To view the
Vertical Access St. Thomas project profile, go to http://www.vertical-access.com/stthomas.html
-Kelly Streeter
|
 |
|
Removed portion of stone cap
|
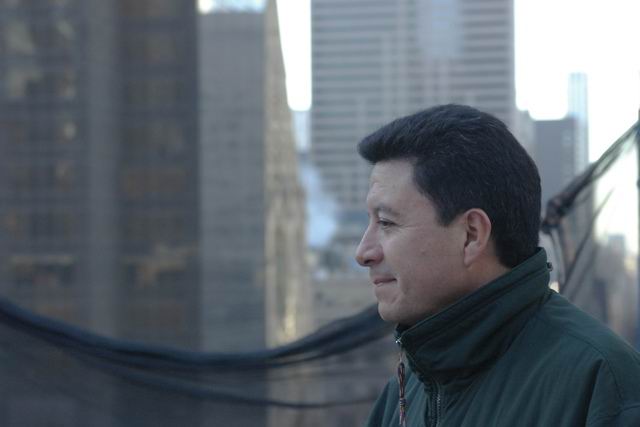
Angel Estrada |
back
to top
VA
in the News: Structure Magazine
 |
|
Cleveland Tower, Princeton, NJ
|
|
Structural
engineers and architects are frequently asked to render opinions on
the conditions of building facades and other structure, but may not
be allowed a budget that permits hands-on inspection using
traditional means of access such as pipe staging, suspended
scaffolding or aerial lifts. Relying purely on visual
condition assessments made from a distance often results in a high
degree of uncertainty during the design and construction phases of a
restoration projects, leading to construction changes order and cost
over-runs.
- an excerpt
from an article by Kent Diebolt and James Banta
To read the
entire article, click here.
|
|
|
|